
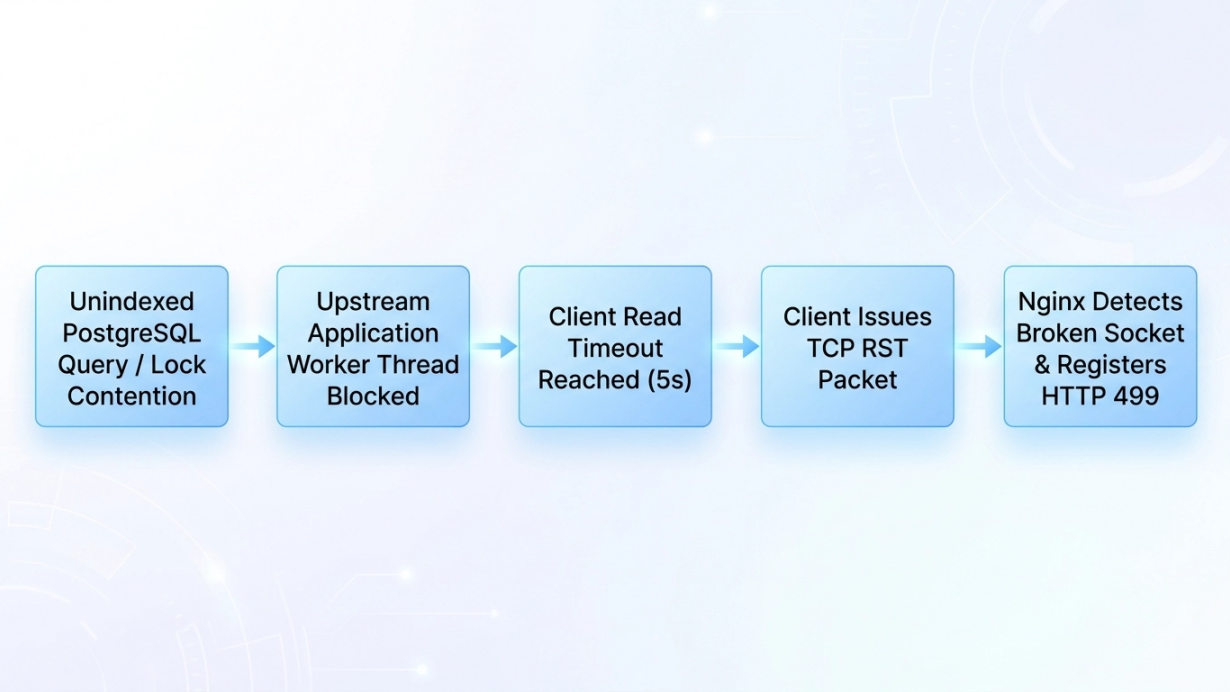
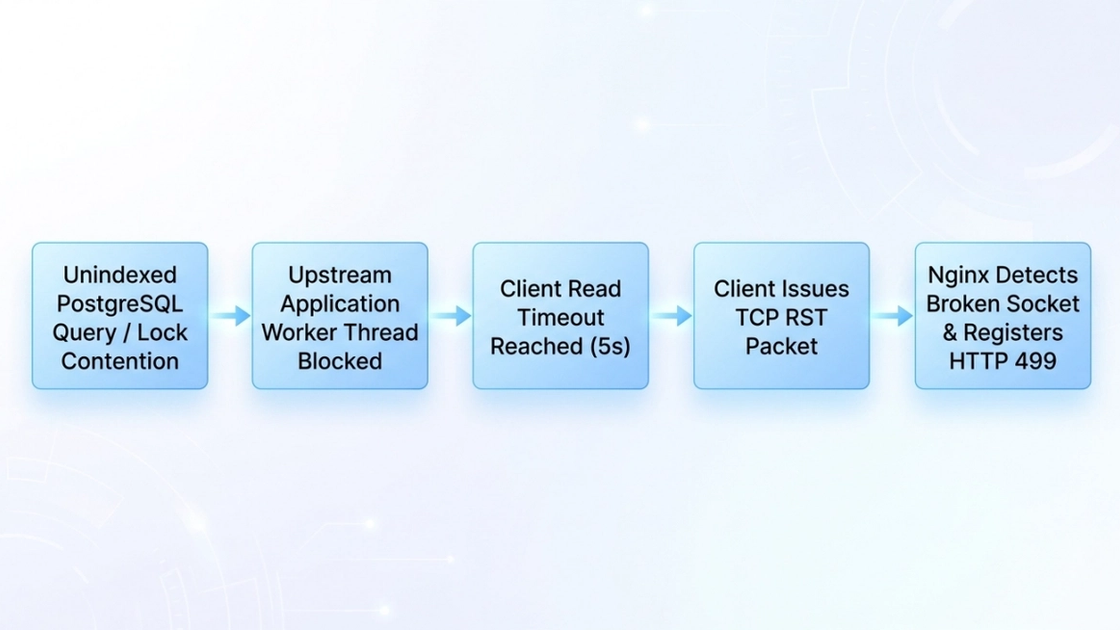
An HTTP 499 status code is Nginx's internal record that the downstream client closed its connection before Nginx could send the response headers. It is not an IETF-registered HTTP response sent to the client. Treat it as a diagnostic signal: the immediate event happened on the client-facing connection, while the underlying cause may be a user cancellation, a client timeout, an edge proxy, network instability, or slow upstream work.
TL;DR Executive Summary
Start with the affected URI and Nginx request time, then correlate the event with application traces and database latency. A cluster of 499 entries during P99 latency growth often points to an upstream bottleneck, but no fixed percentage applies to every environment. Do not increase every timeout blindly. First identify which layer ended the request, then align client, edge, Nginx, application, and database limits around measured behavior.
Is HTTP 499 a Client Fault or a Server Fault?
The label describes a client-side disconnect, not a universal root cause. A user can navigate away, a script can hit its own read timeout, an edge proxy can close the origin connection, or a slow application can keep the client waiting too long.
What Is HTTP 499 "Client Closed Request"?
Protocol Reality: Why HTTP 499 Is Not in the IETF Status Registry
RFC 9110 defines standard HTTP semantics, but Nginx uses 499 internally when a client connection closes before response headers are sent. Because the socket is already closed, Nginx cannot deliver a 499 response line to that client; the value appears in access logs and monitoring.
Standard Response Flow vs. Nginx 499 Logging
In a normal flow the client sends a request, Nginx forwards it, the upstream returns a response, and Nginx sends it downstream. In a 499 flow, the downstream connection closes before headers are sent, so Nginx finalizes the request and logs 499.
Nginx Event Loop and Socket Lifecycle
Nginx monitors downstream and upstream connections independently. The official development guide identifies NGX_HTTP_CLIENT_CLOSED_REQUEST (499) as an error-finalization result. Do not assume every cancellation produces a standalone TCP RST; the low-level close varies by protocol and connection reuse.
499 vs. 504 vs. 408 vs. 444
Status | Standard? | Who closes or responds? | Typical observation | Common investigation |
|---|---|---|---|---|
499 Client Closed Request | Nginx internal code | Downstream client or edge connection closes first | Nginx is still processing or waiting upstream | Client timeout, cancellation, edge timeout, network loss, or upstream latency |
504 Gateway Timeout | Standard HTTP status | Gateway returns a timeout response | Nginx waits too long between upstream reads | Hung or slow upstream, dependency delay, or timeout mismatch |
408 Request Timeout | Standard HTTP status | Server returns a timeout response | Client does not finish sending the request in time | Slow upload, stalled connection, or defensive timeout |
444 No Response | Nginx extension | Nginx closes without response headers | Explicit Nginx policy terminates the connection | Security or traffic-management rule |
Root Causes: Client, Server, Edge, and Network
Cause 1: Frontend and User Cancellation
Single-page applications cancel stale requests when routes, searches, or components change. That behavior may be correct; debounce duplicate actions and classify expected aborts instead of treating every 499 as an incident.
let activeController;

async function loadSearch(query) {
  activeController?.abort();
  activeController = new AbortController();
  try {
    const response = await fetch(
      `/api/v1/search?q=${encodeURIComponent(query)}`,
      { signal: activeController.signal }
    );
    return await response.json();
  } catch (error) {
    if (error.name === "AbortError") return null;
    throw error;
  }
}
Cause 2: Backend Latency and Database Contention
A client can have a shorter patience window than a slow query or dependency. Check traces, pool saturation, lock waits, slow queries, and queue depth before changing proxy settings.
Cause 3: Edge and CDN Timeout Misalignment
A CDN can be the downstream client seen by origin Nginx. Cloudflare currently documents a default 125-second Proxy Read Timeout for Error 524, with plan-specific options. If the edge closes first, Nginx can log 499; check current documentation instead of relying on a historical 100-second value.
Cause 4: Client Scripts and Network Instability
Automation clients can close requests when their own timeout expires. Packet loss, overloaded intermediaries, DNS failures, or a mismatched timeout budget can contribute. A proxy is another hop and does not automatically reduce errors.
How to Fix HTTP 499 on the Client and in Scripts
Debounce Duplicate UI Requests
Cancel obsolete work deliberately and log AbortError separately from network failures.
Use Bounded Timeouts and Safe Retries
import os
import requests
from requests.adapters import HTTPAdapter
from urllib3.util.retry import Retry

target_url = os.environ["AUTHORIZED_URL"]
proxy_url = (
    "http://"
    f"{os.environ['MIYAIP_USERNAME']}:{os.environ['MIYAIP_PASSWORD']}"
    "@gateway.miyaip.com:10000"
)
session = requests.Session()
session.proxies.update({"http": proxy_url, "https": proxy_url})
retries = Retry(total=3, backoff_factor=0.5, status_forcelist=[502, 503, 504])
session.mount("https://", HTTPAdapter(max_retries=retries))
response = session.get(target_url, timeout=(10, 30))
response.raise_for_status()
print(response.status_code)
Keep credentials in environment variables, retry only idempotent operations, use backoff, and point AUTHORIZED_URL only at a system you control or are permitted to test.
Proxy Characteristics and 499 Investigation
Route type | Session behavior | Useful authorized scenario | 499 investigation note | No guarantee |
|---|---|---|---|---|
Datacenter route | Usually stable infrastructure egress | CI, APIs, and general server traffic | Check congestion, provider incidents, and client timeouts | Destination acceptance and latency vary |
Dynamic residential | Rotating or sticky sessions | Authorized localization and distributed testing | Avoid rotating during a request; inspect session policy and route health | Rotation does not prevent disconnects |
Static residential | Fixed ISP-sourced egress | Authorized sessions needing continuity | Verify the assigned route, DNS, and end-to-end timeout budget | Fixed egress does not eliminate 499 |
How to Fix HTTP 499 in Nginx and Upstream Services
Tune Nginx Directives from Measurements
Nginx documents proxy_read_timeout 60s as the default, measured between successive upstream reads rather than across the entire response. proxy_ignore_client_abort defaults to off.
upstream backend_cluster {
    server 10.0.0.10:8080 max_fails=3 fail_timeout=30s;
    keepalive 64;
}

server {
    listen 443 ssl;
    http2 on;
    server_name api.example.com;

    location / {
        proxy_pass http://backend_cluster;
        proxy_http_version 1.1;
        proxy_set_header Connection "";
        proxy_set_header Host $host;
        proxy_set_header X-Request-ID $request_id;
        proxy_connect_timeout 10s;
        proxy_send_timeout 60s;
        proxy_read_timeout 60s;
    }
}
Validate syntax against the deployed Nginx version. Continuing upstream work after a client disconnect can consume capacity; prefer idempotent queues for durable payments, writes, and webhooks.
Bound Database Work Safely
-- PostgreSQL: scope this value to the current transaction.
BEGIN;
SET LOCAL statement_timeout = '5s';
SELECT ...;
COMMIT;

-- MySQL: MAX_EXECUTION_TIME applies to read-only SELECT statements.
SELECT /*+ MAX_EXECUTION_TIME(5000) */ ...;
Apply query-, transaction-, role-, or session-scoped limits that match the application. A timeout is a guardrail, not a replacement for indexes, capacity planning, and query optimization.
Correlate Nginx Logs with Traces
Add a request ID or W3C trace context at the edge. Compare request URI, request time, upstream timing, service spans, connection pools, and database locks.
HTTP 499 Remediation Matrix
System tier | Monitor | Common causes | Recommended action | Priority |
|---|---|---|---|---|
Database | Query duration, lock waits, pool usage | Slow queries, lock contention, exhausted connections | Optimize queries, add justified indexes, and apply scoped timeouts | P0 when customer traffic is blocked |
Application | P95/P99 latency, queues, CPU, memory | Blocking I/O, dependency delay, saturated workers | Trace the slow path, bound concurrency, and move durable work to queues | P0 when capacity is exhausted |
Nginx / edge | 499 rate, request time, upstream time | Layered timeout mismatch or downstream disconnect | Identify the closing layer, then align measured limits | P1 |
Client scripts | Connect/read timeout, retries, route health | Aggressive timeouts, retry storms, network failure | Use bounded retries, idempotency, and route diagnostics | P1 |
Frontend UX | Cancellations, duplicate actions, route changes | Expected aborts or rapid duplicate requests | Debounce and classify intentional cancellations | P2 |
Five-Step Emergency Triage Checklist
1. Confirm the Signal and Scope
Check Nginx access logs, the affected URI, request time, upstream time, user agent, and time window. Separate intentional browser cancellations from clusters that grow with latency.
awk '$9 == 499 {print $7}' /var/log/nginx/access.log \ | sort | uniq -c | sort -rn | head -n 102. Correlate Traces, Pools, and Locks
Look up request IDs in the tracing system. Check service spans, database lock queues, connection pools, and external dependencies before changing timeouts.
3. Identify the Closing Layer
Compare browser or client logs, CDN events, Nginx timing, and application traces. Confirm whether a user cancellation, client read timeout, edge timeout, or network failure fired first.
4. Apply the Smallest Safe Fix
Optimize the slow path, reduce duplicate calls, adjust one measured timeout boundary, or repair the failing route. Do not hide a capacity problem by raising every limit.
5. Validate Under Load and Keep an Audit Trail
Reproduce the request in a controlled environment, verify error rate and latency, document the change, and define rollback thresholds.
Frequently Asked Questions
What does HTTP 499 mean?
It means Nginx observed that the downstream client connection closed before response headers were sent. It is an internal logging code, not an IETF-registered response delivered to that client.
Is HTTP 499 a client error or a server error?
The immediate event is a downstream disconnect, but the root cause can be user cancellation, client policy, an edge timeout, network failure, or slow upstream work.
What is the difference between HTTP 499 and 504?
A 499 is logged when the downstream connection closes first. A 504 is a gateway response when the gateway's upstream wait reaches its timeout condition.
Should I enable proxy_ignore_client_abort?
Only for a carefully designed workload that should continue after the requester leaves. It can consume upstream capacity; durable work is usually better placed in an idempotent job queue.
Can a proxy cause or fix HTTP 499?
A proxy adds another network layer and can contribute to latency or disconnection. A healthier route may help an authorized workload, but no route type guarantees the absence of 499.
Sources
Nginx Development Guide — HTTP request finalization
Nginx proxy module documentation
Cloudflare Error 524 documentation
PostgreSQL client connection defaults
A proxy changes routing; it does not authorize access, guarantee destination acceptance, or replace observability and capacity work.
Diagnose permitted routes without hiding the root cause
Use MiyaIP static residential proxies when a test needs stable ISP egress, or dynamic residential proxies for approved rotation and location targeting.